This morning I found out about this really great visualization of several GPT models. I spent 15 minutes playing with it and kind of having my mind blown. Give it a try, noting that:
- There are four models present; click on the four model buttons at the top to orient yourself
- Use the left mouse button to move around, middle or right mouse button to rotate and mouse wheel to zoom
- Blue rectangles are weight matrices, green are activations
Cheers to Brendan Bycroft for putting that site together!
The thing that really blew me away was the difference in scale between the different models. Static screen shots really don’t do it justice—you need to play with it yourself—but here are some pics anyways.
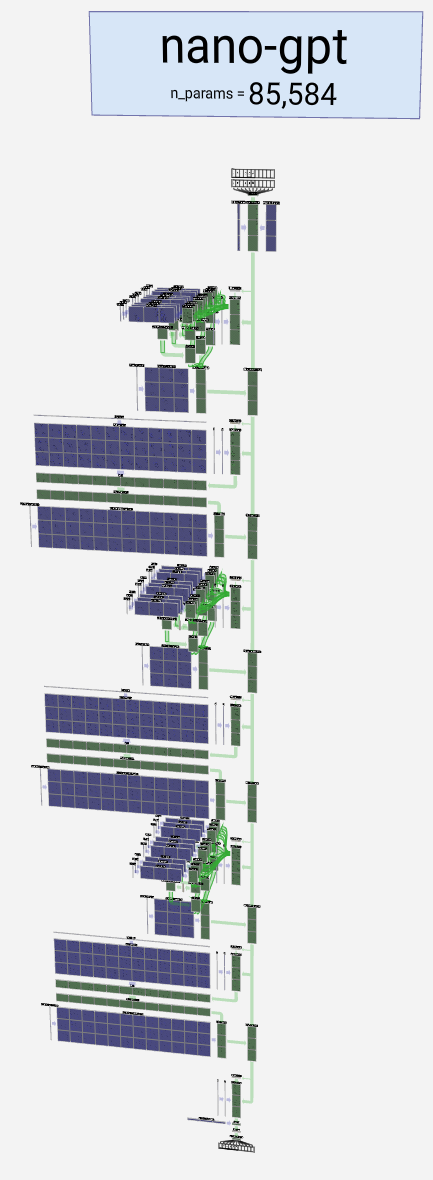
Here’s a visualization of nanoGPT. This model has a mere 86k parameters:
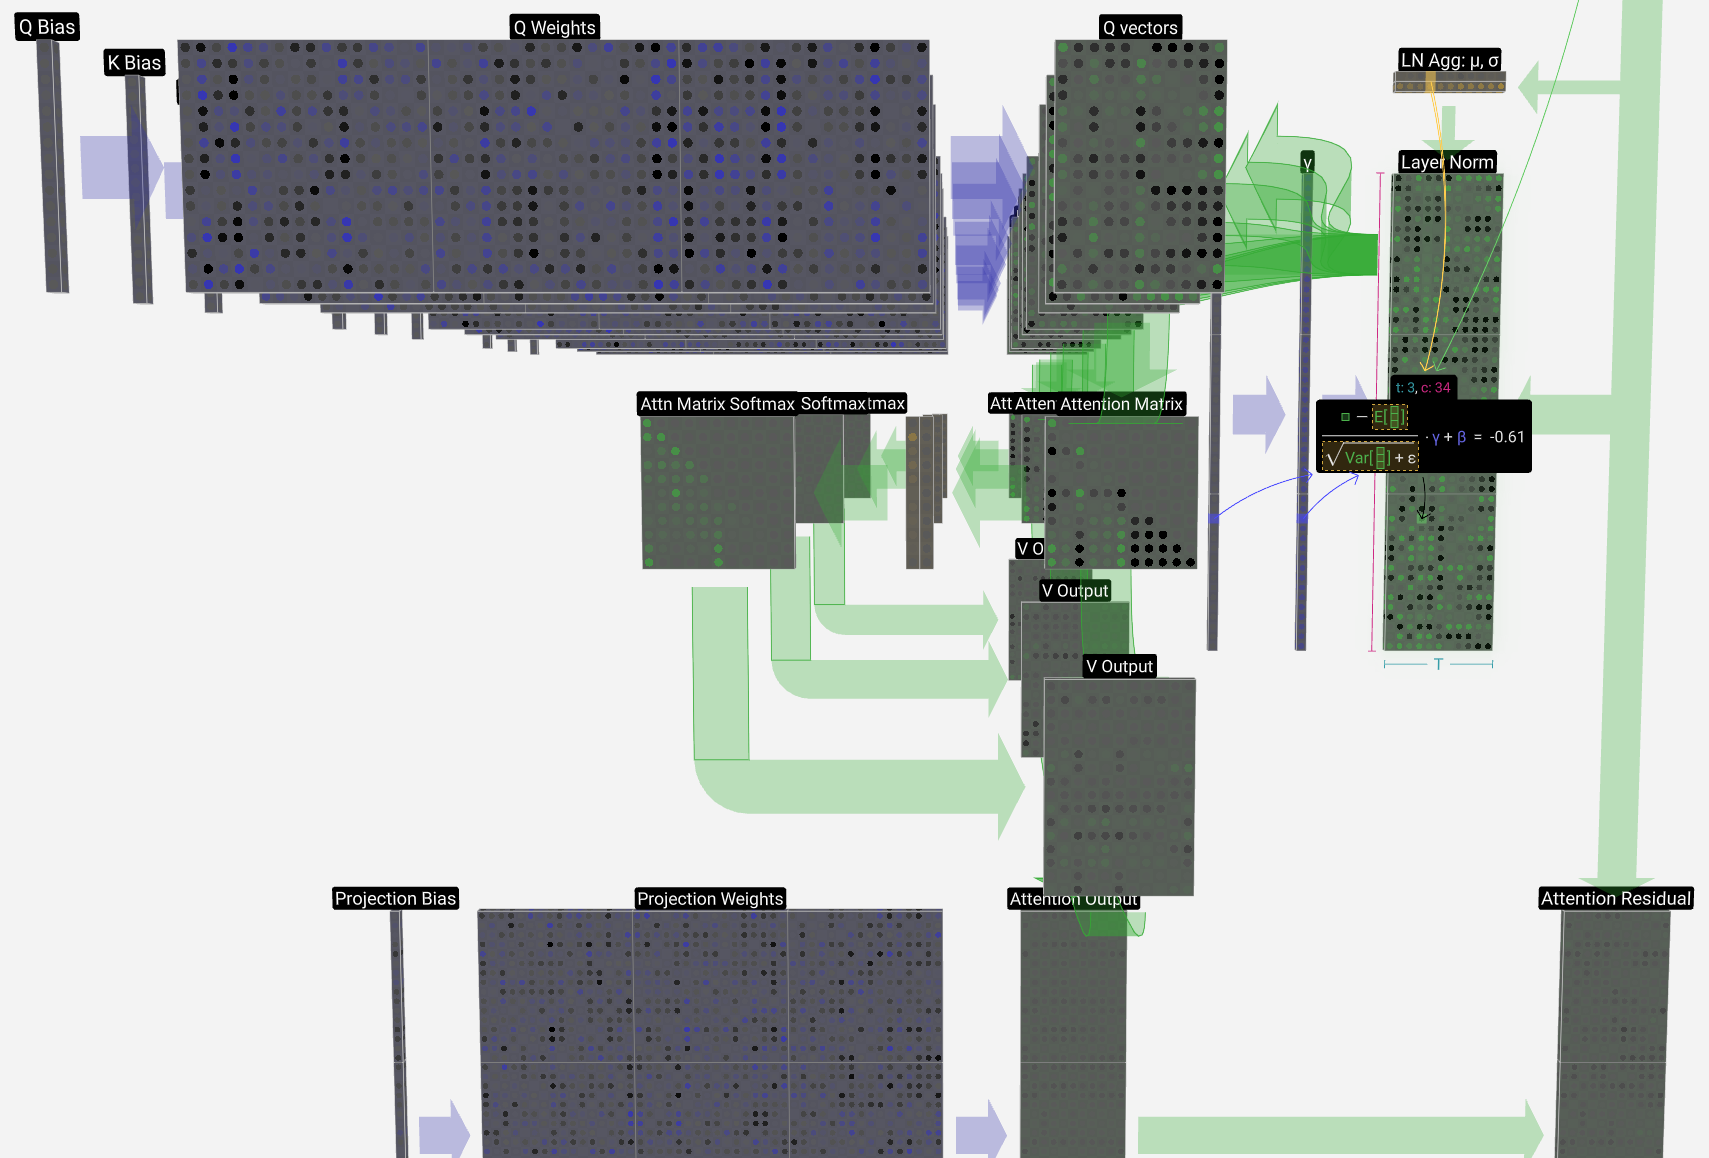
If we zoom in a bit you can see some of the detail. Brendan’s amazing visualization for this smallest model includes calculations for many of the activations:
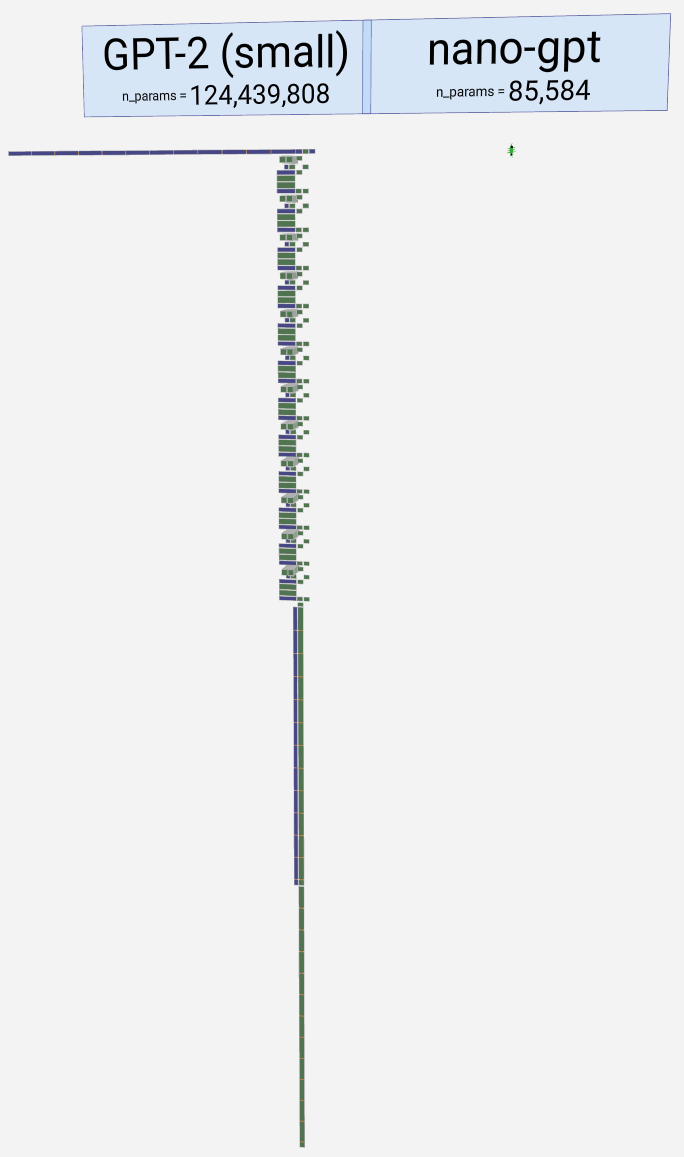
Now we zoom way out, so that nanoGPT is just a teeny-tiny dot, and on the left we see the (relative) colossus GPT-2 small, at 124M params:
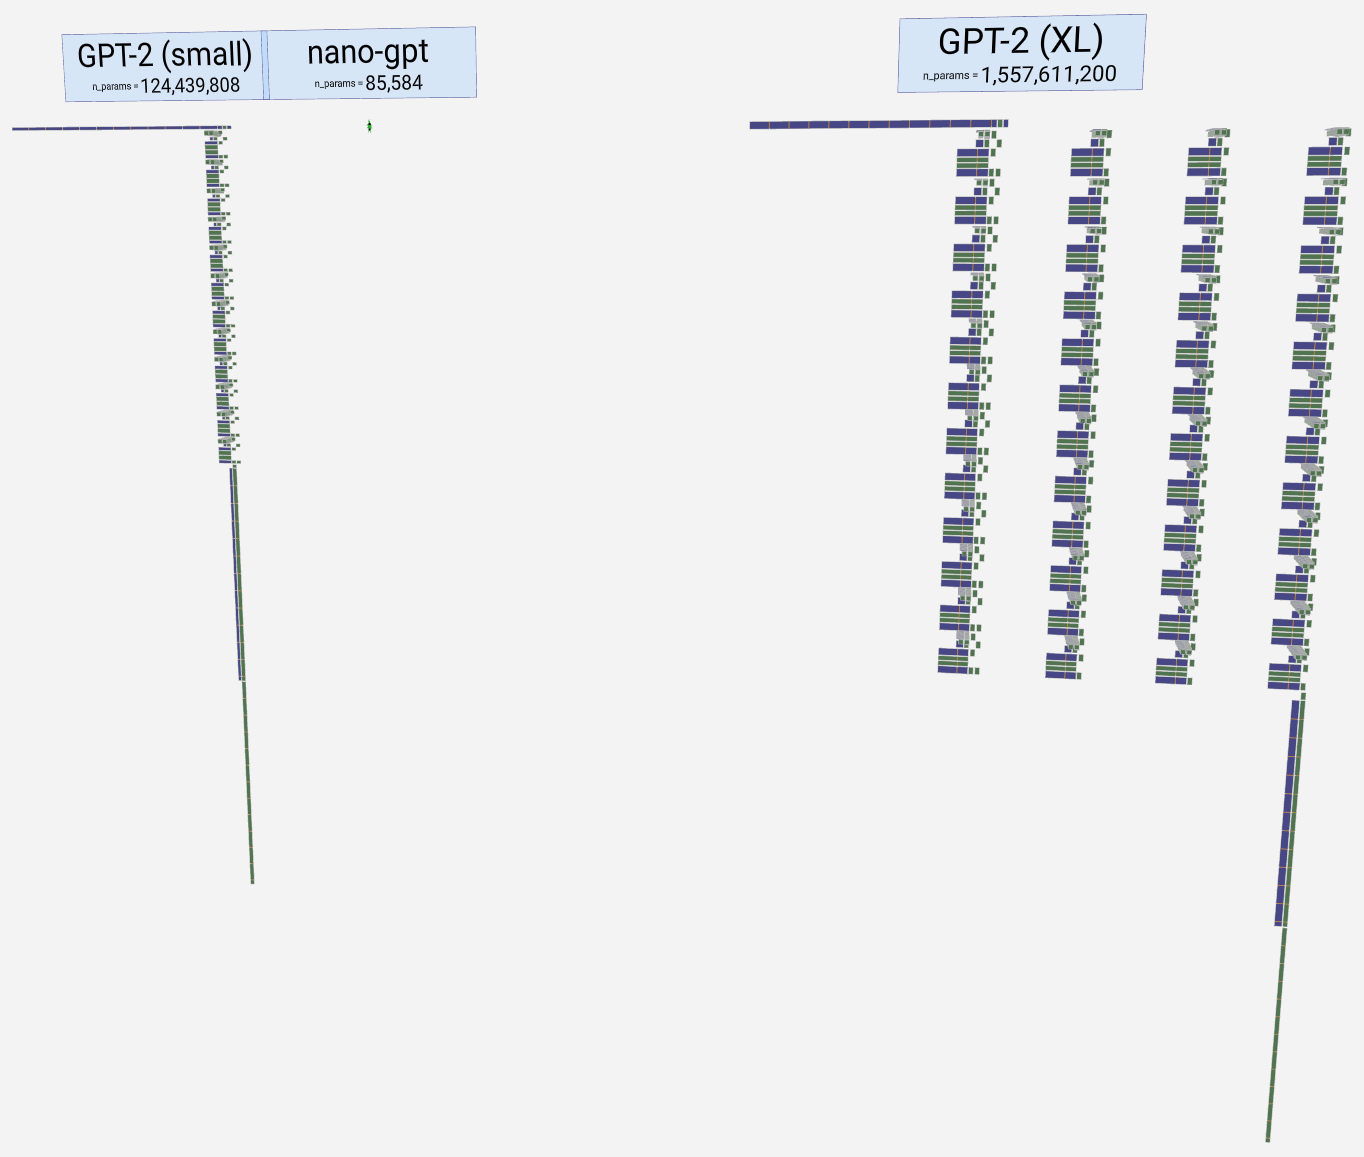
Keep zooming out, and eventually we see GPT-2 XL on the right (1.6B params). NanoGPT is there in the middle, barely visible:
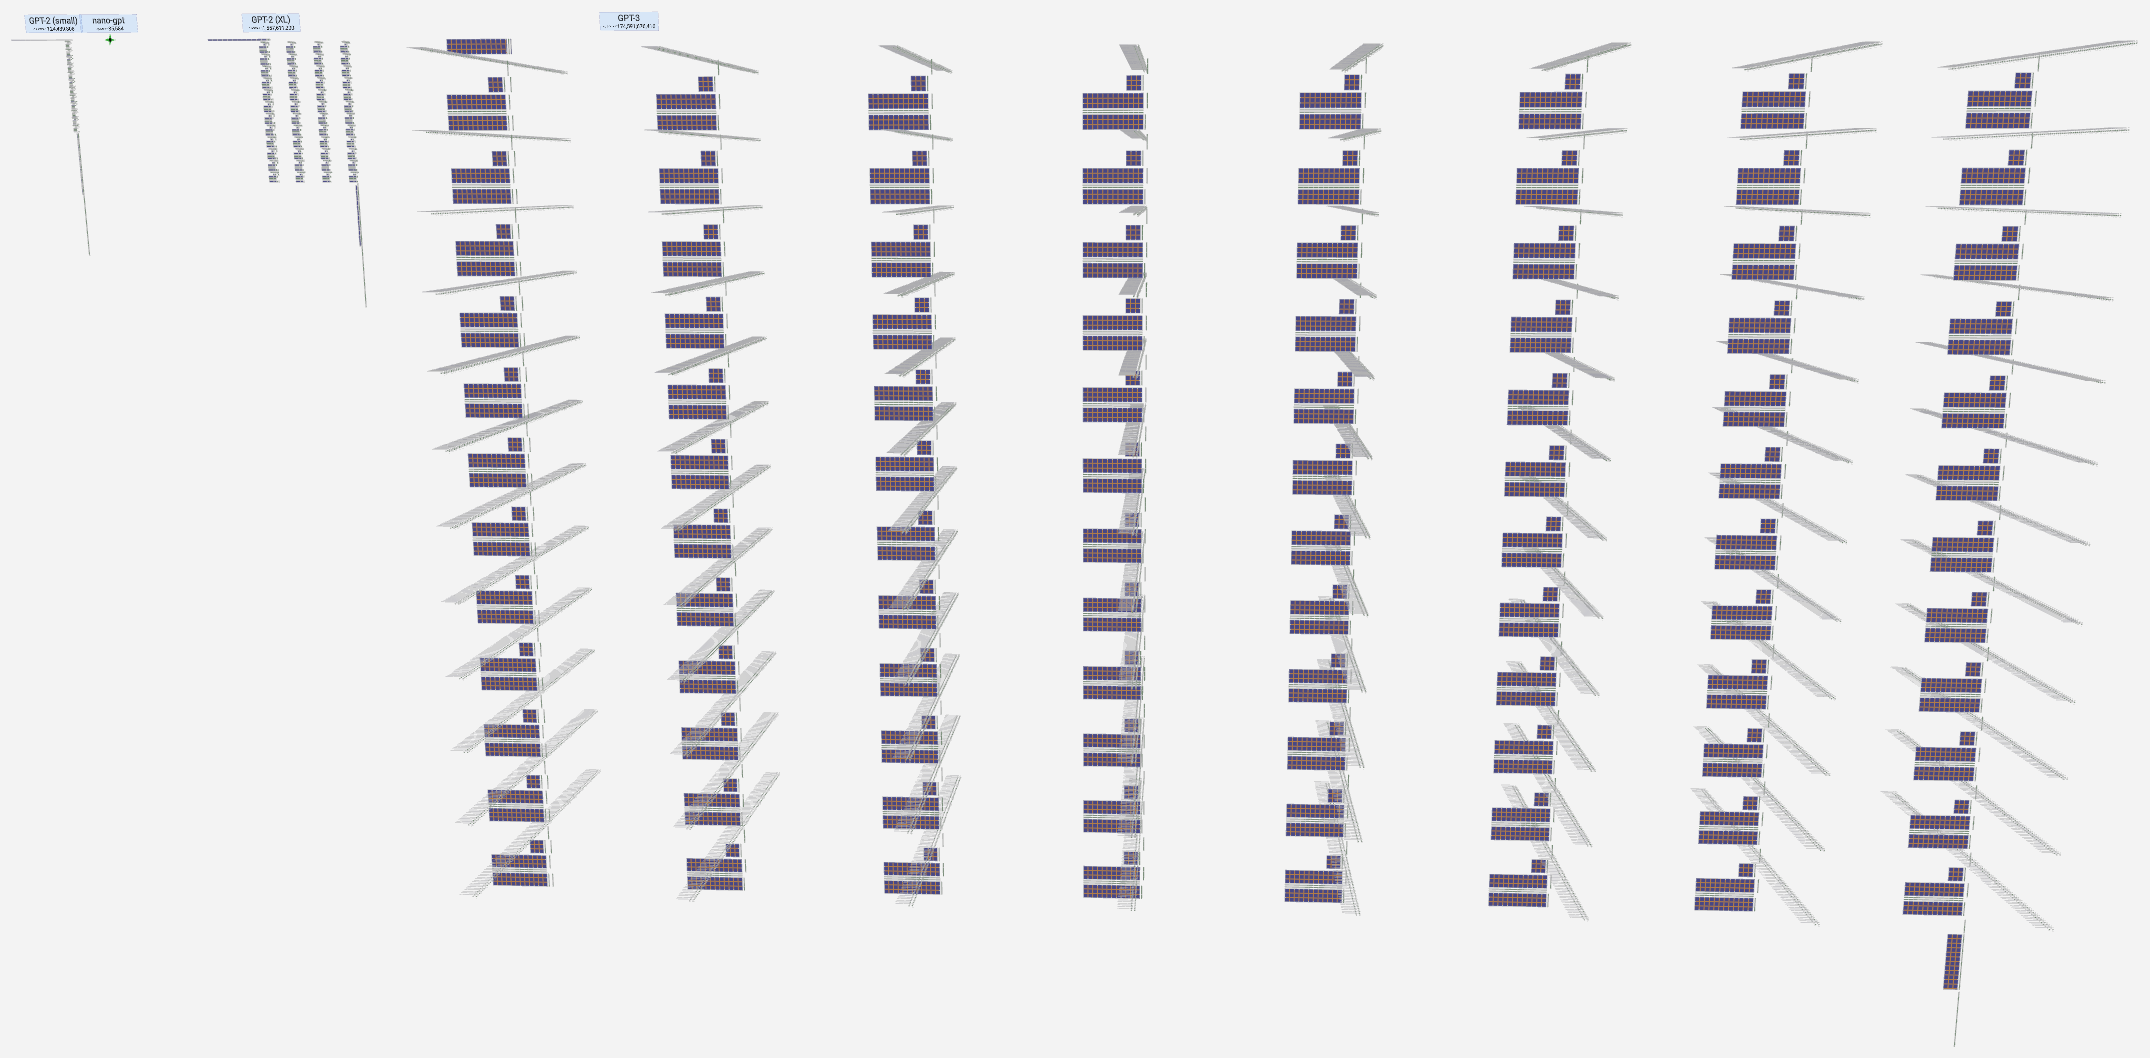
Zoom out yet further, and eventually we see GPT-3, at 175B params (2 million times as many weights as nanoGPT, which we barely even notice second from the left):
The unexpected changes of scale remind me a bit of this video (well, a little bit!). I think they are both striking examples of how poorly-equipped humans are to understand things that span orders of magnitude.